

Key B2B Sales Metrics: What to Track (and Why They Actually Matter)
B2B sales metrics only matter when they change what you do next week.
I’ve been burned by a “great pipeline.”
CRM looked full. Reports looked strong. In meetings, we were “on track.” Then reality hit: backlog was missing, and suddenly close dates moved on most opportunities because budget decisions got delayed.
The quarter didn’t go bad overnight. We were already off plan. We just didn’t measure the right things to see it early.
That’s the problem with most dashboards. They make you feel safe because opportunity value looks big.
Here’s the standard I use now:
A B2B sales metric is only useful if it triggers a decision for next week.
If it doesn’t change action, it’s reporting. Not management.
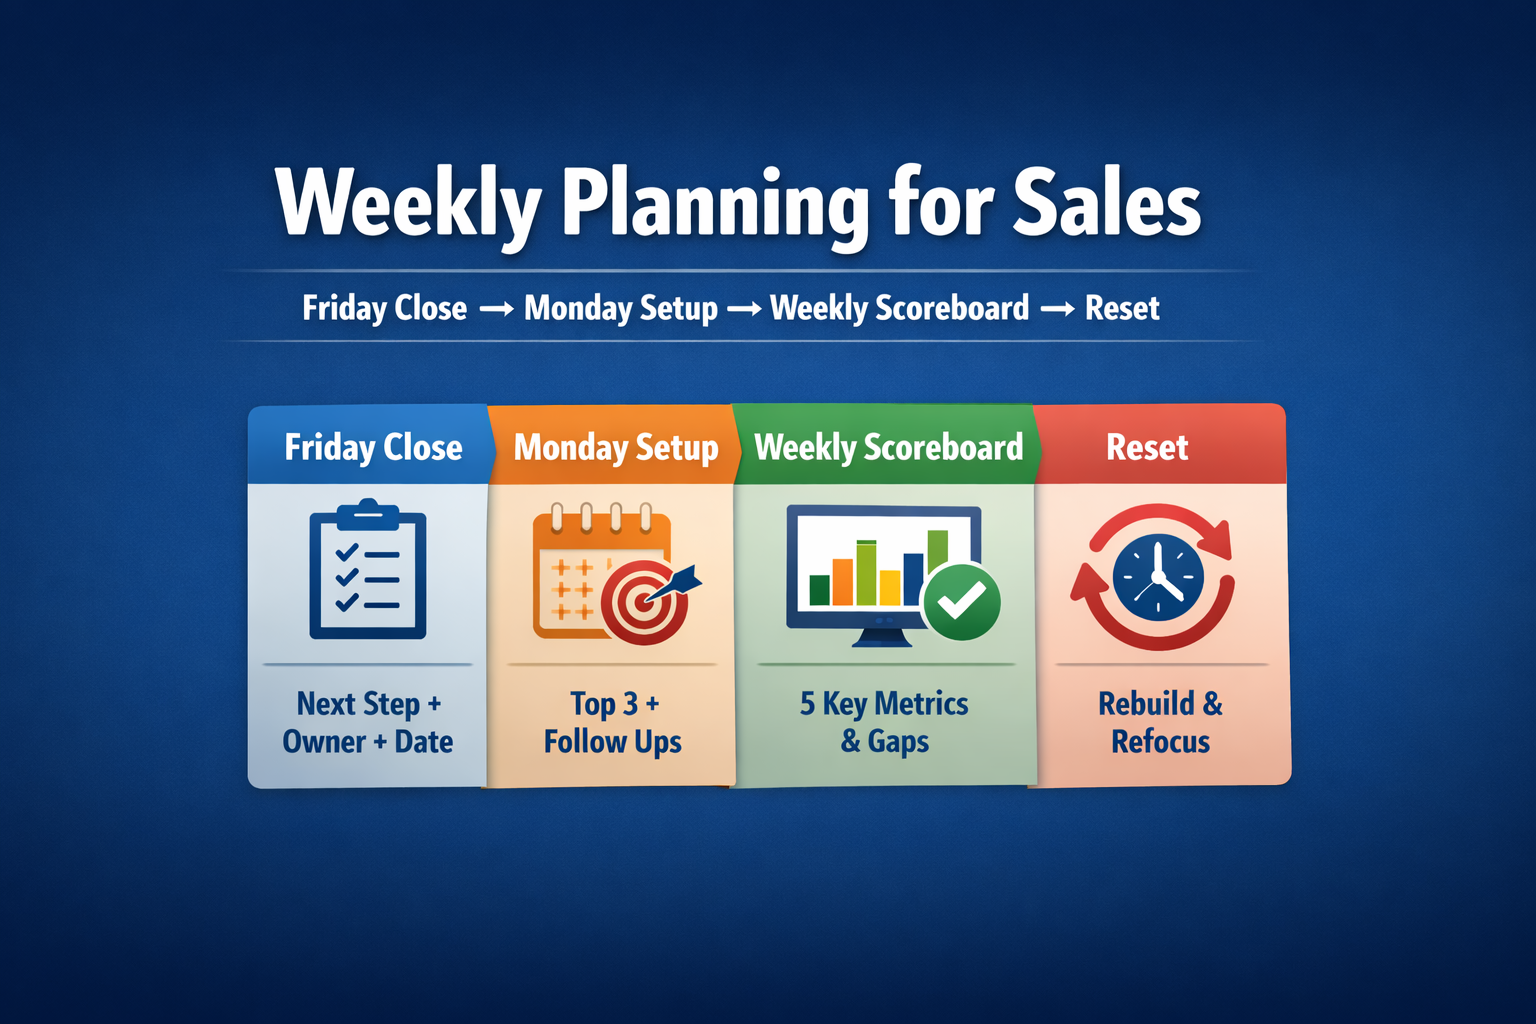
f you want a simple way to turn those decisions into action every Monday, use my weekly planning for sales routine (Friday Close + Monday Setup + scoreboard)
If a metric term is unclear, check the Sales Terminology Glossary for B2B.
If your pipeline looked full but you still missed plan, you weren’t tracking the right B2B sales metrics. This guide shows the numbers that force reality (slippage, close-date accuracy, budget-confirmed pipeline, and order intake vs target) and the exact actions to take when they turn red—so you stop getting surprised at month-end.
At a Glance
If you want B2B sales metrics that actually prevent surprises, track two layers:
- Pipeline & Forecast (intent + timing): weighted pipeline, slippage, close-date accuracy, budget-confirmed pipeline, forecast accuracy (commit)
- Order Execution (reality flow): order intake vs target (PO only), backlog coverage, invoiced vs target, invoice conversion
Rule: If a metric doesn’t trigger a decision for next week, delete it.
These B2B sales metrics are the minimum set that prevents pipeline surprises.
The Only Rule: A Metric Must Change a Decision
For every metric on your dashboard, answer two questions:
- What decision does this drive?
- What do we do when it moves? (trigger → action)
If you can’t answer those in one sentence, it’s noise.
The three buckets that keep metrics operational
- Activity metrics (inputs): good for coaching and capacity, easy to game.
- Pipeline & forecast metrics (conversion + trust): tell you what is likely, and whether timing is real.
- Order execution metrics (commitment + delivery + billing): tell you what the business will actually ship and invoice.
Now let’s get into the metrics that prevent pipeline theater.
B2B Sales Metrics for Pipeline & Forecast: Intent → Timing → Trust
Your story happens when the dashboard answers the wrong question.
It answers: “How big is the pipeline?”
It does not answer: “How much of this will convert on time, with budget approved?”
Weighted pipeline
What it tells you: likely value, not hope.
Trigger: unweighted looks strong but weighted is weak.
Action: tighten qualification + stage exit criteria; downgrade fake late-stage.
Coverage by stage
One total coverage number hides reality. Track coverage by stage so you can see if you can close enough this month/quarter.
Trigger: late-stage coverage is thin.
Action: focus on the “PO path” on top deals: budget approval, procurement steps, legal review, signature sequence.
Slippage rate (deals pushed)
This is the early warning system that your quarter is breaking.
Trigger: late-stage pushes spike (value + count).
Action: run a slippage review now; require milestone-based dates; downgrade stage if no evidence.
Close-date accuracy
If dates are fiction, forecasting is fiction.
Trigger: % of deals closing in the forecasted month drops.
Action: no close date without a customer-owned milestone (budget meeting window, approval event, procurement slot, legal review date).
Budget-confirmed pipeline
Since your root cause was budget delays, you need a metric that separates “interested” from “funded.”
Trigger: budget-confirmed pipeline is low compared to total pipeline.
Action: stop calling deals “commit” without budget owner + decision window.
Forecast trust metrics (commit)
Pipeline isn’t a forecast. Trust is built on forecast vs actual. If you want the clean distinction (and how to stop confusing the two), see Sales Pipeline vs. Forecast: The Difference (and Why Most Reps Confuse Them).
Track:
- forecast accuracy (commit)
- commit coverage (commit/target)
- forecast hygiene (next step/date present, stale late-stage deals)
Want a simple way to quantify forecast accuracy without overthinking it? One common approach is forecast error percentage: (|Actual − Forecast| / Actual) × 100. Reference: HubSpot: Track the accuracy of forecasts.
Also remember: a sales forecast feeds budgeting, staffing, and resource decisions. That’s why forecast trust matters. When timing is wrong, the business plans off fiction. Reference: Salesforce: Sales forecasting guide.
Ruthless rule: if “commit” is always 1.0+ and you still miss, “commit” is not a forecast category. It is a vibe. Fix definitions.
B2B Sales Metrics for Order Execution: Order Intake → Backlog → Invoiced
Pipeline is intent. Reality starts at signature.
[Image] Pipeline → Order Intake (PO/Contract) → Backlog (Open Orders / Not Delivered Yet) → Invoiced Sales
Order intake (PO/contract only)
This is your truth metric. Keep it clean.
Track:
- order intake vs budget/target (week + MTD, month + QTD)
- gap to target (order intake)
Trigger: behind plan.
Action: stop debating pipeline size. Attack PO blockers: budget approval path, procurement, legal review, signature sequence.
Backlog (open orders / not delivered yet)
Backlog is your execution buffer.
Track:
- backlog coverage vs remaining target
- backlog trend
- backlog aging (only if it drives action)
Trigger: backlog is thin.
Action: prioritize PO-ready deals and align capacity constraints early.
Invoiced sales (invoiced/recognized)
Important for plan tracking, dangerous for blame. Invoiced can lag for delivery, acceptance, milestones, disputes, admin.
Track:
- sales vs budget/target (month + QTD)
- invoice conversion = invoiced $ / order intake $ (monthly/quarterly)
- blocked invoices (if you can tag reasons)
Trigger: invoiced behind plan while bookings are fine.
Action: treat it as execution/billing blockers; don’t “panic-prospect.”
If you want a broader reference list of common sales KPIs (useful for readers who want definitions), this is a solid starting point: HubSpot: Sales metrics and KPIs.
The One-Page Dashboard: Weekly + Monthly + QBR
If you don’t show vs target and gap, your dashboard is a story, not a control system.
Weekly dashboard (15 minutes)
Targets and gaps
- order intake vs budget/target (week + MTD), PO/contract only
- gap to target (order intake): $____
- sales vs budget/target (invoiced/recognized, if you review weekly)
- gap to target (sales): $____
If you want the monthly version of this (and the exact formula + action routine), run a gap-to-budget analysis.
Pipeline & forecast (reality)
- weighted pipeline (month/quarter)
- late-stage coverage (month/quarter)
- budget-confirmed pipeline (value + count)
- slippage this week (value + count)
- close-date accuracy trend
Execution
- backlog coverage vs remaining target
- blocked invoices (value)
[Image] One-page layout with blocks for Targets, Pipeline & Forecast, Order Execution
Monthly pack (same layers, cleaner trend view)
At the top, always show:
- sales vs budget/target (invoiced/recognized), month + QTD
- order intake vs budget/target, month + QTD
- gaps for both
Then:
- backlog coverage + trend + aging
- invoice conversion + blocked invoices
QBR metrics (spell it out once)
A Quarterly Business Review (QBR) should be a decision meeting, not a slide show.
Bring:
- sales vs target (invoiced), order intake vs target
- forecast accuracy trend, close-date accuracy trend
- slippage top reasons (budget decision delayed counts)
- pipeline health trends (weighted pipeline, late-stage coverage, budget-confirmed pipeline)
- backlog coverage trend, invoice conversion trend
Before the QBR, pull this scorecard and bring these metrics so the meeting becomes decisions, not slides.
Core Mini-Table: The Metrics That Actually Matter
If you only track six metrics, start here: weighted pipeline, slippage, close-date accuracy, budget-confirmed pipeline, order intake vs target, and sales vs target (invoiced).
| Metric | What it tells you | Trigger (red flag) | Action |
|---|---|---|---|
| Weighted pipeline | Likely value | Big gap vs unweighted | Tighten qualification; enforce stage exits; downgrade fake late-stage |
| Slippage ($ + #) | Quarter breaking early | Late-stage pushes spike | Slippage review; milestone-based dates; downgrade/close |
| Close-date accuracy | Timing trust | Timing misses rising | No date without customer milestone |
| Budget-confirmed pipeline | What can be real commit | Low vs total pipeline | Keep out of commit until owner + window is clear |
| Order intake vs target (PO only) | Signed business pace | Behind plan | Attack PO blockers; focus on conversion |
| Sales vs target (invoiced) | Financial plan tracking | Behind plan | Fix execution/billing blockers, not pipeline pep talks |
| Backlog coverage | Execution buffer | Backlog thin | Prioritize PO-ready; align capacity early |
| Invoice conversion | Orders → invoices flow | Drops/stalls | Fix delivery/acceptance/billing bottlenecks |
| Stage conversion hotspot | Bottleneck stage | One stage drops | Add checklist + exits; coach that stage |
| Stage aging (late stages) | Stale late-stage | Aging increases | Force next step/date or downgrade/close |
Templates: Weekly Scorecard, Slippage Review, QBR One-Slide
Weekly metrics scorecard (copy/paste)
Weekly Scorecard (Week of ____ )
Targets
* Target (Month): $____
* Target (Quarter): $____
Results vs plan
* Order intake vs target (PO/contract only): $____ / $____ → Gap: $____
* Sales vs target (invoiced/recognized): $____ / $____ → Gap: $____
Pipeline & forecast
* Weighted pipeline (Month): $____
* Late-stage coverage (Month): ____x
* Budget-confirmed pipeline: $____ (____ deals)
* Slippage this week: $____ (____ deals pushed)
* Close-date accuracy (rolling 30 days): ____%
Execution
* Backlog coverage vs remaining target: ____x
* Blocked invoices (value): $____
This week’s 3 decisions (max)
1. ______________________________
2. ______________________________
3. ______________________________
Slippage review script (use when budget delays hit)
For each pushed deal:
- What exactly moved (budget meeting, approval committee, procurement slot, legal)?
- What is the new customer-owned milestone date and owner?
- Is budget confirmed or still “expected”?
- What is the next step on the calendar (with date)?
- What changes in forecast right now (date/stage/amount/close-lost)?
Hard outcomes:
* No milestone date → push date now and downgrade stage.
* No budget confirmation → not commit.
* No buying process → close-lost.
QBR one-slide template
* Sales vs target (invoiced): $____ / $____ (Gap $____)
* Order intake vs target: $____ / $____ (Gap $____)
* Forecast accuracy (commit): ____%
* Close-date accuracy trend: ↑ / ↓
* Slippage trend: ↑ / ↓ (top reason: budget decision delayed)
* Weighted pipeline trend: ↑ / ↓
* Late-stage coverage trend: ↑ / ↓
* Budget-confirmed pipeline trend: ↑ / ↓
* Backlog coverage trend: ↑ / ↓
* Invoice conversion trend: ↑ / ↓
* 3 decisions next quarter: 1) ___ 2) ___ 3) ___
Level up your B2B sales, one fix at a time.
Want the full Metric → Trigger → Action tables (pipeline/forecast + order execution) without cluttering the article?
Download the Extended Tables + Templates
Want the full Metric → Trigger → Action tables (pipeline/forecast + order execution) without cluttering the article?
Download the companion file here: Extended Tables + Templates (DOCX)
Conclusion: Metrics Don’t Win Deals, They Stop You From Lying to Yourself
I learned this the hard way: B2B sales metrics don’t win deals, but they stop you from lying to yourself.
My dashboard looked great, but budget decisions slipped, close dates moved, and the backlog didn’t show up. The problem wasn’t effort. The problem was measurement. I was tracking volume instead of reality.
If you take only one thing from this guide, take this:
Pick a small set of metrics that forces truth.
* Pipeline truth: weighted pipeline, slippage, close-date accuracy, budget-confirmed pipeline
* Execution truth: order intake vs target, backlog coverage, invoiced vs target
Then attach a trigger and an action to every number. If a metric doesn’t change what you do next week, delete it.
Don’t ask “does the pipeline look big?”
Ask: “What will convert on time, with budget approved, and what do we do if it doesn’t?”
FAQ: Key B2B Sales Metrics
Start with metrics that force truth: weighted pipeline, slippage, close-date accuracy, budget-confirmed pipeline, order intake vs target, and invoiced sales vs target. Everything else is secondary unless it triggers a decision.
Pipeline is the universe of potential deals. A forecast is the subset you expect to close within a specific period and timing. If you want the clean distinction, use:
Sales Pipeline vs. Forecast: The Difference (and Why Most Reps Confuse Them).
There’s no universal “3x is enough” rule. Coverage depends on win rate, deal quality, segment, and cycle length. Use coverage by stage and validate it against your historical conversion rates.
Fix close-date accuracy and slippage first. Most forecast misses are timing misses. Enforce: no close date without a customer-owned milestone (budget decision window, procurement slot, legal review date).
Track budget-confirmed pipeline separately and treat it as the filter for “commit.” If budget owner and approval window aren’t clear, keep the deal out of commit and adjust the close date now instead of at quarter-end.
Track both, but don’t mix them with pipeline. Order intake (PO/contract) is commitment. Invoiced sales is financial timing and can lag due to delivery/acceptance/billing. Use both to spot execution bottlenecks.
Weekly for: order intake vs target, slippage, close-date accuracy, weighted pipeline. Monthly for: backlog and invoiced vs target trends. Quarterly for: win rate and cycle trends by segment.
Bring: invoiced vs target, order intake vs target, forecast accuracy trend, close-date accuracy trend, slippage reasons, weighted pipeline trend, and backlog coverage trend. Then structure the meeting properly:
How to Prepare for Sales Meetings: A Step-by-Step Guide to Impress Clients and Win Trust.


